
Abstract
The 4+2 Pipeline Thrust Matrix is a growth marketing planning framework that aligns marketing's objectives with sales and enterprise goals, then plans and runs initiatives against them. It is built for high-ticket, sales-led B2B organisations (enterprise and industrial first) where deals are large, cycles run for months, a buying group decides, and marketing has to prove its contribution to pipeline. Four pillars create thrust. Two foundations cut drag by building trust. The framework plugs into the demand waterfall, MEDDPICC and account-based marketing rather than replacing them. This paper is written for practitioners. Academics can cite it; it is not written for them.
Who this is for. Growth and marketing leaders who own the marketing plan in sales-led B2B. Sales leaders and CXOs who want one shared view of growth work. Teams who already have a CRM and a revenue conversation, and need a structure that connects company goals to the initiative portfolio. If you present to a revenue committee, or wish you did, this paper is for you.
Who this is not for. Low-ticket, self-serve or product-led motions, where a funnel or product-led model fits better. Consumer brands. Choosing which markets or products to grow: that is strategy (Ansoff, BCG); the 4+2 starts after that choice is made. Pure SaaS product-led growth. Sales-led SaaS can use the same structure; the worked example and exhibits in this paper stay with enterprise and industrial B2B.
1. The problem: marketing as a cost centre
When the board can only see what marketing can attribute, marketing looks like a cost centre. That is a measurement habit, not a verdict on value.
In high-ticket, sales-led B2B (enterprise software sold with a field force, industrial equipment, specialised services), the buying group is real, the cycle is long, and much of marketing's best work happens before a CRM stage ever opens. If the only number that counts is the last touch before opportunity create, you will systematically under-fund the work that makes deals faster and larger later. You will also train the organisation to treat marketing as a lead factory. Lead factories get cut when bookings slip. Profit-centre marketing gets a seat when bookings are planned.
I have spent years on both sides of that argument. Across my agency years I ran ₹38Cr+ in ad spend across 200+ campaigns. The pattern that kept repeating was not a lack of work. It was a lack of line of sight. Campaigns shipped. Leads arrived. Sales said the leads were soft. Finance asked for return on ad spend. Marketing defended the dashboard. Nobody could show, on one page, how the initiative portfolio connected to the sales target and the enterprise goal. The spend was real. The contribution story was not. That is the gap this framework closes, not by inventing attribution theatre, but by forcing the plan to start from the same goals sales already carries.
Three habits make this worse.
First, vanity metrics are treated as results. Clicks, impressions and marketing-qualified leads are inputs. They matter. They are not pipeline contribution. When the plan is built around inputs, the revenue conversation never starts.
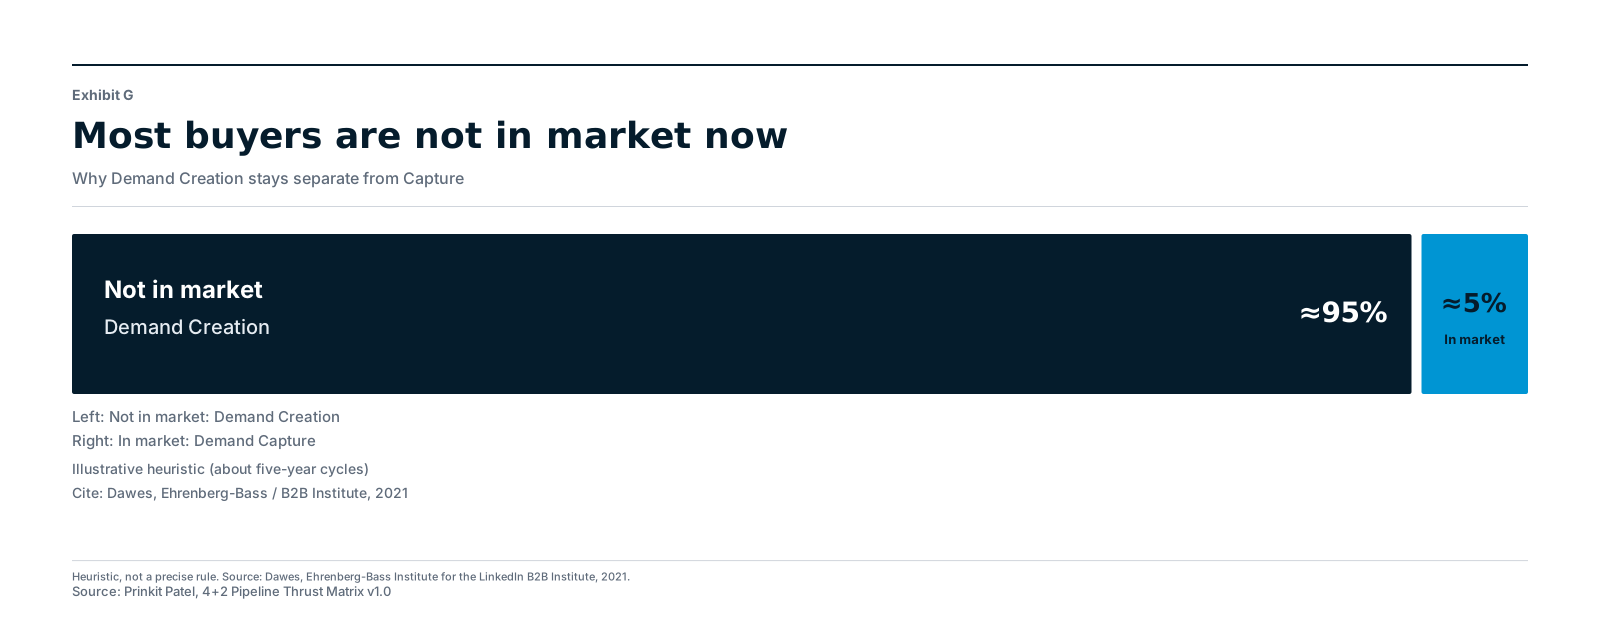
Second, attribution gaps are mistaken for value gaps. Most B2B journeys involve a buying group, long cycles and work that shapes preference months before an opportunity exists. John Dawes, writing for the Ehrenberg-Bass Institute and the LinkedIn B2B Institute, puts the point as a heuristic: for many goods and services, something like 95% of buyers are not in the market in a given quarter, because provider switching often runs on multi-year cycles.[1] Advertising that reaches those buyers is not wasted. It builds memory that activates when they do enter the market. If your reporting only credits the last click before a form fill, you will under-count Creation and over-claim Capture.
Third, brand and activation are planned as rivals. Les Binet and Peter Field, in The 5 Principles of Growth in B2B Marketing for the LinkedIn B2B Institute, show that B2B marketing works best when long-term brand building and short-term sales activation work together. Binet and Field's data suggests efficiency appears to be maximised at roughly 46% brand and 54% activation: a rough estimate from a small sample, not a law, and one that varies by category.[2] Teams that fund only activation starve tomorrow's pipeline. Teams that fund only brand cannot answer this quarter's sales target.
I am not arguing against measurement. I am arguing against incomplete measurement dressed up as a verdict. When a buying group takes six months to decide, and marketing's only credited touch is the last webinar registration, you have not measured contribution. You have measured convenience. Sales feels the gap as "marketing sends soft leads". Finance feels it as "we cannot see return". Marketing feels it as being invited to the revenue meeting only to defend a slide. Everyone is reacting to the same missing line of sight.
The fix is not a louder dashboard. It is a shared plan: enterprise goal, sales target, marketing contribution, then the initiatives that move that contribution, each with one owner and one primary metric.
The missing piece is not another deal methodology. Sales already has MEDDPICC, Challenger and SPIN for that. The missing piece is not another stage model. The waterfall already measures how demand flows. What marketing lacks is a planning framework that starts from enterprise and sales objectives and ends in a balanced, owned, measured initiative portfolio, so marketing earns a seat in the revenue plan because its work is visible in the same language sales and the board already use.
That is the job of the 4+2.
2. The framework: four pillars create thrust; two foundations cut drag
Name. 4+2 Pipeline Thrust Matrix. Everyday shorthand: the 4+2.
One line. The 4+2 is a growth marketing planning framework that aligns marketing's objectives with sales and enterprise goals, then plans and runs initiatives against them.
The metaphor. Think of an engine. Four pillars create thrust: they add pipeline volume, speed deals up and grow customers. Two foundations cut drag: they reduce friction from poor data, buyer doubt and weak handoffs. Trust reduces friction. Volume and speed together make momentum; Retention & Expansion keeps the engine running. Revenue is the forward motion, not the exhaust. Fix the drag before you add more thrust. More spend cannot fix a leaky pipeline.
I built the 4+2 because the frameworks I met were a poor fit for high-ticket, sales-led work outside the usual SaaS playbook. Funnels describe how buyers move. They do not organise marketing's initiative portfolio against a sales target. Flywheels value retention but rarely give you a sector-and-buyer-type grid you can run with sales every month. I needed one structure to visualise, plan, present and diagnose, and to put marketing in the same conversation as revenue.
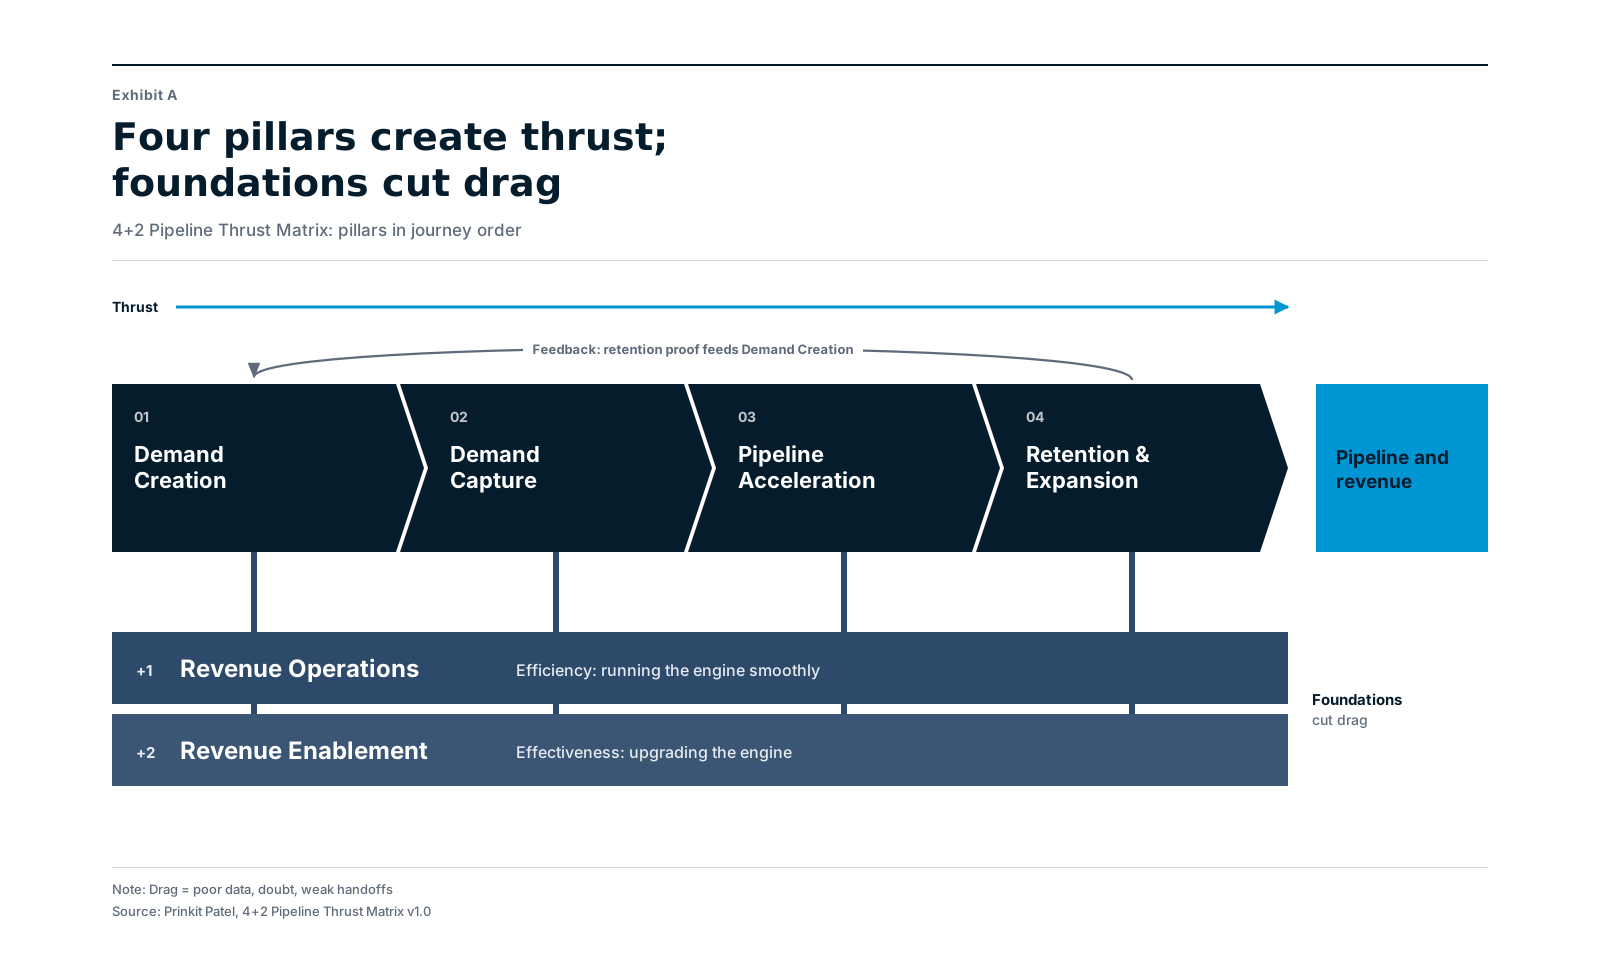
The master is the only picture you need in a revenue meeting. Everything else in this paper zooms into one part of it: roles, line of sight, a worked example, or how it sits next to tools you already use.
The four pillars (buyer-journey order)
| # | Pillar | Role |
|---|---|---|
| 01 | Demand Creation | Be remembered before buyers enter the market. Build awareness and preference among the large share of buyers who are not in-market yet. |
| 02 | Demand Capture | Turn in-market intent into qualified opportunities. |
| 03 | Pipeline Acceleration | Win buying-group consensus so deals close faster and stall less. |
| 04 | Retention & Expansion | Keep customers and grow their value after the first order. Proof from here feeds Demand Creation. |
Creation and Capture are separate on purpose. Dawes's 95-5 heuristic explains why.[1] Creation works on the out-of-market majority. Capture works on the in-market minority. Mixing them into one "demand gen" budget usually starves Creation and floods Capture with soft leads.
Pipeline Acceleration is where marketing stops pretending the handoff is the finish line. In enterprise and industrial deals, the hard work is often consensus: economic buyer, user lead, procurement, finance, sometimes an influencer the CRM never named. Marketing that only celebrates "sales accepted the lead" will watch win rates stagnate. Marketing that owns Acceleration (buying-group coverage, proof in the deal, executive briefings timed to stage) shares the speed problem with sales.
Retention & Expansion is not a courtesy pillar. In many industrial and enterprise books, the installed base is where margin and references live. Expansion opportunities on existing accounts belong here, whatever channel raised them. The feedback loop matters: referenceable customers and proof from delivery are fuel for Demand Creation. Without that loop, Creation becomes generic thought leadership with no edge.
The two foundations
| # | Foundation | Role |
|---|---|---|
| +1 | Revenue Operations | Efficiency: run and optimise the shared machinery (data, stages, routing, attribution, reporting) that every pillar uses. |
| +2 | Revenue Enablement | Effectiveness: continually find where the engine can improve, and build or upgrade the capabilities to do it: systems, models, proof, playbooks and skills. |
Trust is the through-line. Buyers who trust you move faster. Sales teams who trust marketing's numbers stop fighting the forecast. A foundation that is weak (dirty data, no shared stage definitions, no proof library) puts drag under every pillar. That is why the foundations sit as a band under all four columns on the master exhibit, not as a fifth and sixth pillar in the journey.
Revenue Operations is not "the CRM team" in disguise. It is the discipline that makes every pillar's metric believable: stages defined the same way for marketing and sales, routing that meets an agreed response time, attribution that can be audited, and routine tuning of models that already exist. Revenue Enablement is not a content graveyard. It is the build muscle: the first scoring model, the first marketing-mix study, the new buying-group playbook, the proof library redesign, with an end date and a handover. Confusing the two is how tool projects never end and pillars never own outcomes.
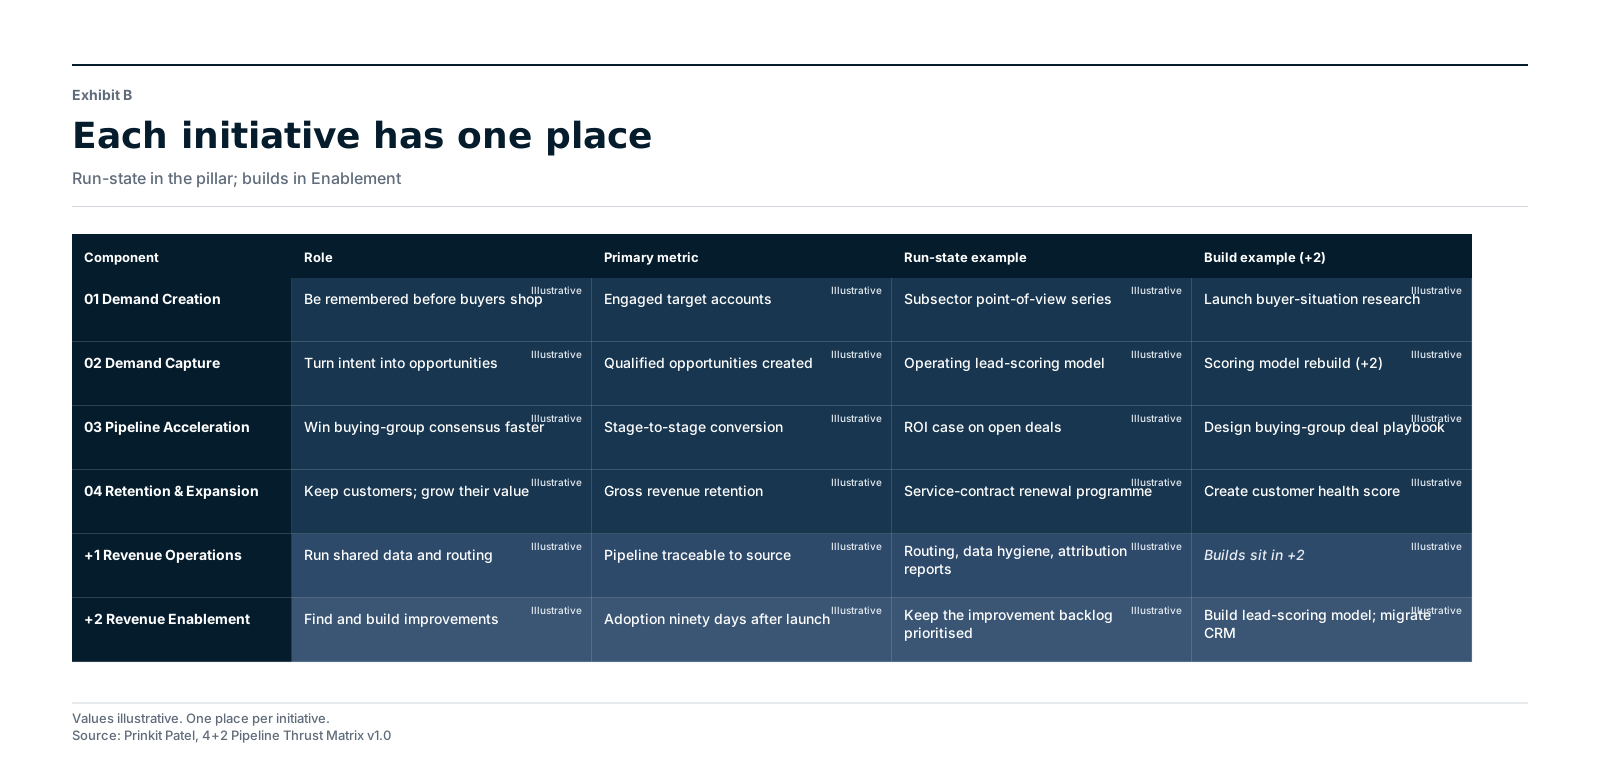
Where work sits (plain language). Each initiative has one place, based on its main job. Knock-on effects are noted, not double-counted.
- Run-state capability sits in the pillar it serves. Example: an operating lead-scoring model sits in Demand Capture, because it identifies and captures demand.
- Shared machinery sits in Revenue Operations. Ongoing data hygiene, routing, stage definitions, attribution runs, and routine recalibration of an existing design.
- Build or upgrade sits in Revenue Enablement. Setting something up from scratch, rebuilding it, or changing its design, usually a project with an end date. Once it is live, the run-state moves to the pillar it serves, or to Revenue Operations if it is shared.
Worked edges: ongoing routing rules sit in Revenue Operations; a CRM migration sits in Revenue Enablement. Routine scoring recalibration sits in Revenue Operations; a scoring rebuild with new features sits in Revenue Enablement; the live model sits in Demand Capture. A playbook in use on open deals sits in Pipeline Acceleration; a new playbook design sits in Revenue Enablement.
North Star and metrics
North Star (decided): marketing's pipeline contribution (marketing-sourced pipeline value plus marketing-influenced pipeline value), reported separately and jointly with sales. Pipeline velocity (qualified opportunities × win rate × average deal value ÷ cycle length) is a secondary indicator, not the North Star.
Influenced pipeline (decided): a marketing touch on a buying-group member within a 90-day lookback window before opportunity creation or before a stage advance. Sales agrees the window. Revenue Operations audits. Sourced and influenced are always reported separately. Do not present a single summed figure without also showing the two parts.
Useful metrics by component (leading towards lagging):
| Component | Metrics |
|---|---|
| Demand Creation | Engaged target accounts; buying groups reached by role; share of branded or direct search |
| Demand Capture | Qualified opportunities created; scored-lead-to-opportunity rate; marketing-sourced pipeline |
| Pipeline Acceleration | Stage-to-stage conversion; sales cycle length; win rate; buying-group roles engaged per opportunity |
| Retention & Expansion | Gross revenue retention; expansion pipeline; referenceable customers |
| Revenue Operations | Share of pipeline traceable to source; speed-to-lead; data completeness; scoring recalibrated on schedule |
| Revenue Enablement | Improvement backlog prioritised; builds shipped on time; adoption 90 days after launch; lift vs pre-build baseline |
How to run it (six steps)
- Diagnose: score each pillar and foundation; find where pipeline leaks.
- Baseline: put numbers on today's state so impact can be proven later.
- Select: choose a few focused plays for the weakest pillar, each with a named owner.
- Map: place each initiative against a sector and buyer type in its pillar.
- Run: review the portfolio with sales every month; rebalance every quarter.
- Measure: report sourced and influenced contribution against the North Star.
A crowded pillar may be over-investment. An empty one is a gap. A weak foundation limits every pillar above it.
Two practical rules keep the portfolio honest. First, if an initiative's main job is to build preference among buyers who are not yet shopping, it belongs in Demand Creation, even if a sales person likes the content. Second, if the work is aimed at accounts that already have an open opportunity, it belongs in Pipeline Acceleration, even if the channel is "marketing". Existing-customer expansion opportunities belong in Retention & Expansion, whatever the channel. Those three rules stop double-counting and stop the calendar from deciding the strategy.
3. Line of sight: from enterprise goal to initiative
The white space the 4+2 owns is not "another pipeline model". It is line of sight: enterprise goal to sales target, to marketing's pipeline contribution, to pillar initiatives and metrics.
OKRs (objectives and key results) are a useful carrier for the same idea (transparent goals cascaded across teams), but they are content-free.[3] They do not tell you which B2B marketing work belongs where. The 4+2 supplies that content.
Level 1: Enterprise strategy (shared). Where the company will grow: priority sectors, mix shifts, geographic bets. The 4+2 does not choose the strategy; it receives it. If marketing invents its own priority list that differs from the enterprise plan, the cascade is already broken.
Level 2: Sales strategy (shared). Priority subsectors and geographies; the revenue or booking target; which accounts and buying groups matter. Marketing's plan starts here, not from channel calendars. Subsectors and geographies belong on this shared block so every pillar column inherits the same focus.
Level 3: Marketing contribution (the North Star). Sourced and influenced pipeline, agreed with sales, reported separately. This is the number that earns the seat. Influenced without a rule is how trust dies; sourced alone is how Creation gets cut.
Levels 4 to 6: Per pillar. Role, metrics as targets, initiatives, next steps. One column each for Demand Creation, Demand Capture, Pipeline Acceleration, and Retention & Expansion. Order matters for planning: set the role, set the metric as the target, choose the initiatives that move it, then name the next steps. Revenue Operations and Revenue Enablement run under every column as the shared band: efficiency and capability building for the whole engine.
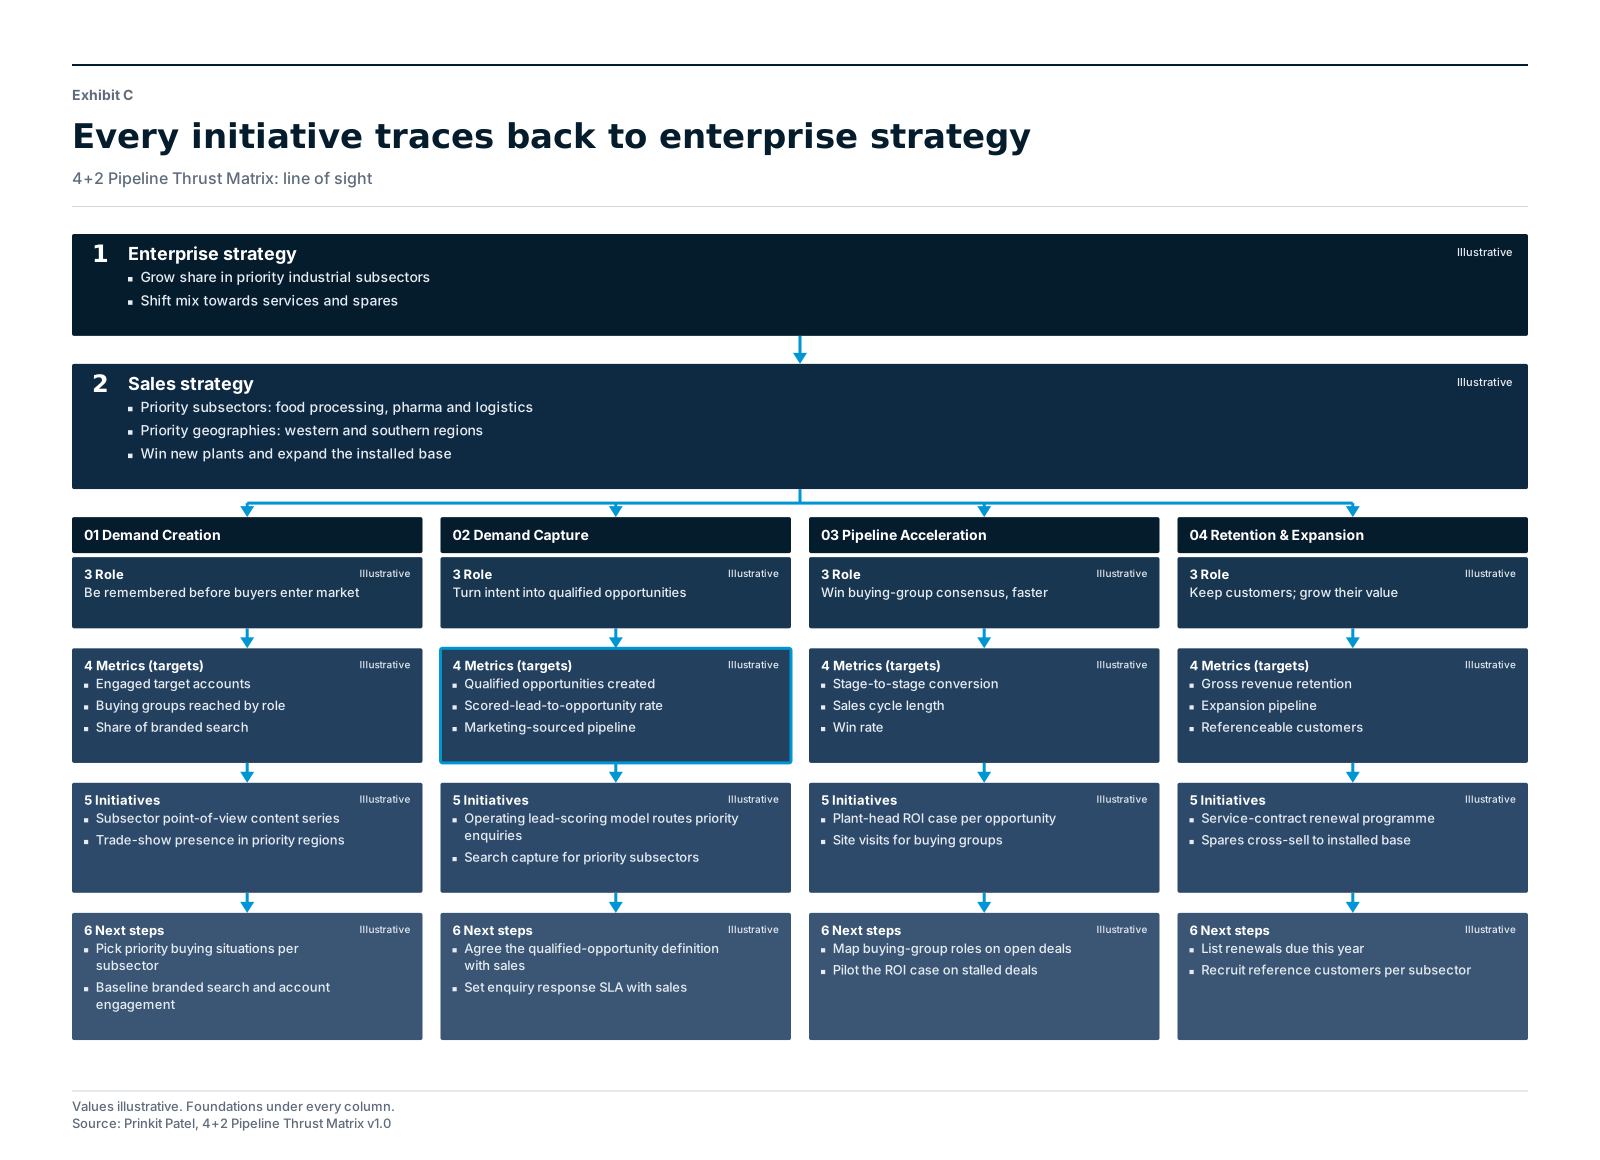
If an initiative cannot be traced up this chain, it does not belong in the portfolio, or the target is wrong. That single test removes a surprising amount of busywork.
In practice, the cascade forces three conversations marketing often skips. With the enterprise team: which sectors and geographies are actually priority this year? With sales: what does a qualified opportunity mean, and what pipeline contribution will marketing own? With finance: will we report sourced and influenced separately, so influence is not a dumping ground? Until those three are answered, channel plans are guesses.
Line of sight also protects Creation. Without it, every budget cut lands on the work whose return is furthest away. With it, Creation has a named contribution to the sales target (future volume and faster deals later), and a metric that sales can see, such as engaged target accounts or branded search among priority roles.
4. Worked example (illustrative; no company named)
Take a sales-led industrial equipment supplier. Large ticket. Months-long cycles. Buying groups that include plant heads, procurement, engineering and finance. Priority subsectors: food processing, pharma and logistics. Priority geographies: western and southern regions. Enterprise aim: grow share in those subsectors and shift mix towards services and spares. Sales aim: win new plants and expand the installed base.
All values below are illustrative. No figures.
Diagnose. Creation is thin in the priority subsectors: plant heads do not recall the brand when a project starts. Capture is noisy: enquiries arrive, but few become qualified opportunities. Acceleration stalls when procurement joins late. Retention is informal: renewals are chased, not planned. Data can be traced to source for only part of pipeline. No shared playbooks for buying-group consensus.
The diagnosis is deliberately qualitative first. You do not need a perfect data warehouse to see the shape of the leak. You need sales in the room and honesty about empty cells. Once the weak pillar is named, baseline the two or three metrics that will prove movement, then select initiatives. Teams that skip baseline end up claiming victory with no shared starting point.
Set targets (metrics as the plan, not the report).
| Pillar | Role | Metric targets (illustrative labels) |
|---|---|---|
| Demand Creation | Be remembered before buyers enter market | Engaged target accounts; buying groups reached by role; share of branded search |
| Demand Capture | Turn intent into qualified opportunities | Qualified opportunities created; scored-lead-to-opportunity rate; marketing-sourced pipeline |
| Pipeline Acceleration | Win buying-group consensus, faster | Stage-to-stage conversion; sales cycle length; win rate |
| Retention & Expansion | Keep customers; grow their value | Gross revenue retention; expansion pipeline; referenceable customers |
Select initiatives (one place each).
| Pillar | Initiatives (illustrative) |
|---|---|
| Demand Creation | Subsector point-of-view content series; trade-show presence in priority regions |
| Demand Capture | Operating lead-scoring model routes priority enquiries; search capture for priority subsectors |
| Pipeline Acceleration | Plant-head ROI case per opportunity; site visits for buying groups |
| Retention & Expansion | Service-contract renewal programme; spares cross-sell to installed base |
Note the scoring model: once live, it sits in Demand Capture. Building it from scratch, or rebuilding it, would sit in Revenue Enablement. Routine recalibration of weights on the same design sits in Revenue Operations.
Next steps.
| Pillar | Next steps (illustrative) |
|---|---|
| Demand Creation | Pick priority buying situations per subsector; baseline branded search and account engagement |
| Demand Capture | Agree the qualified-opportunity definition with sales; set enquiry response SLA with sales |
| Pipeline Acceleration | Map buying-group roles on open deals; pilot the ROI case on stalled deals |
| Retention & Expansion | List renewals due this year; recruit reference customers per subsector |
One trace. The operating scoring model (Demand Capture) lifts scored-lead-to-opportunity rate, which yields more qualified opportunities and marketing-sourced pipeline towards the sales target of winning new plants in the priority subsectors. That is line of sight on one page.
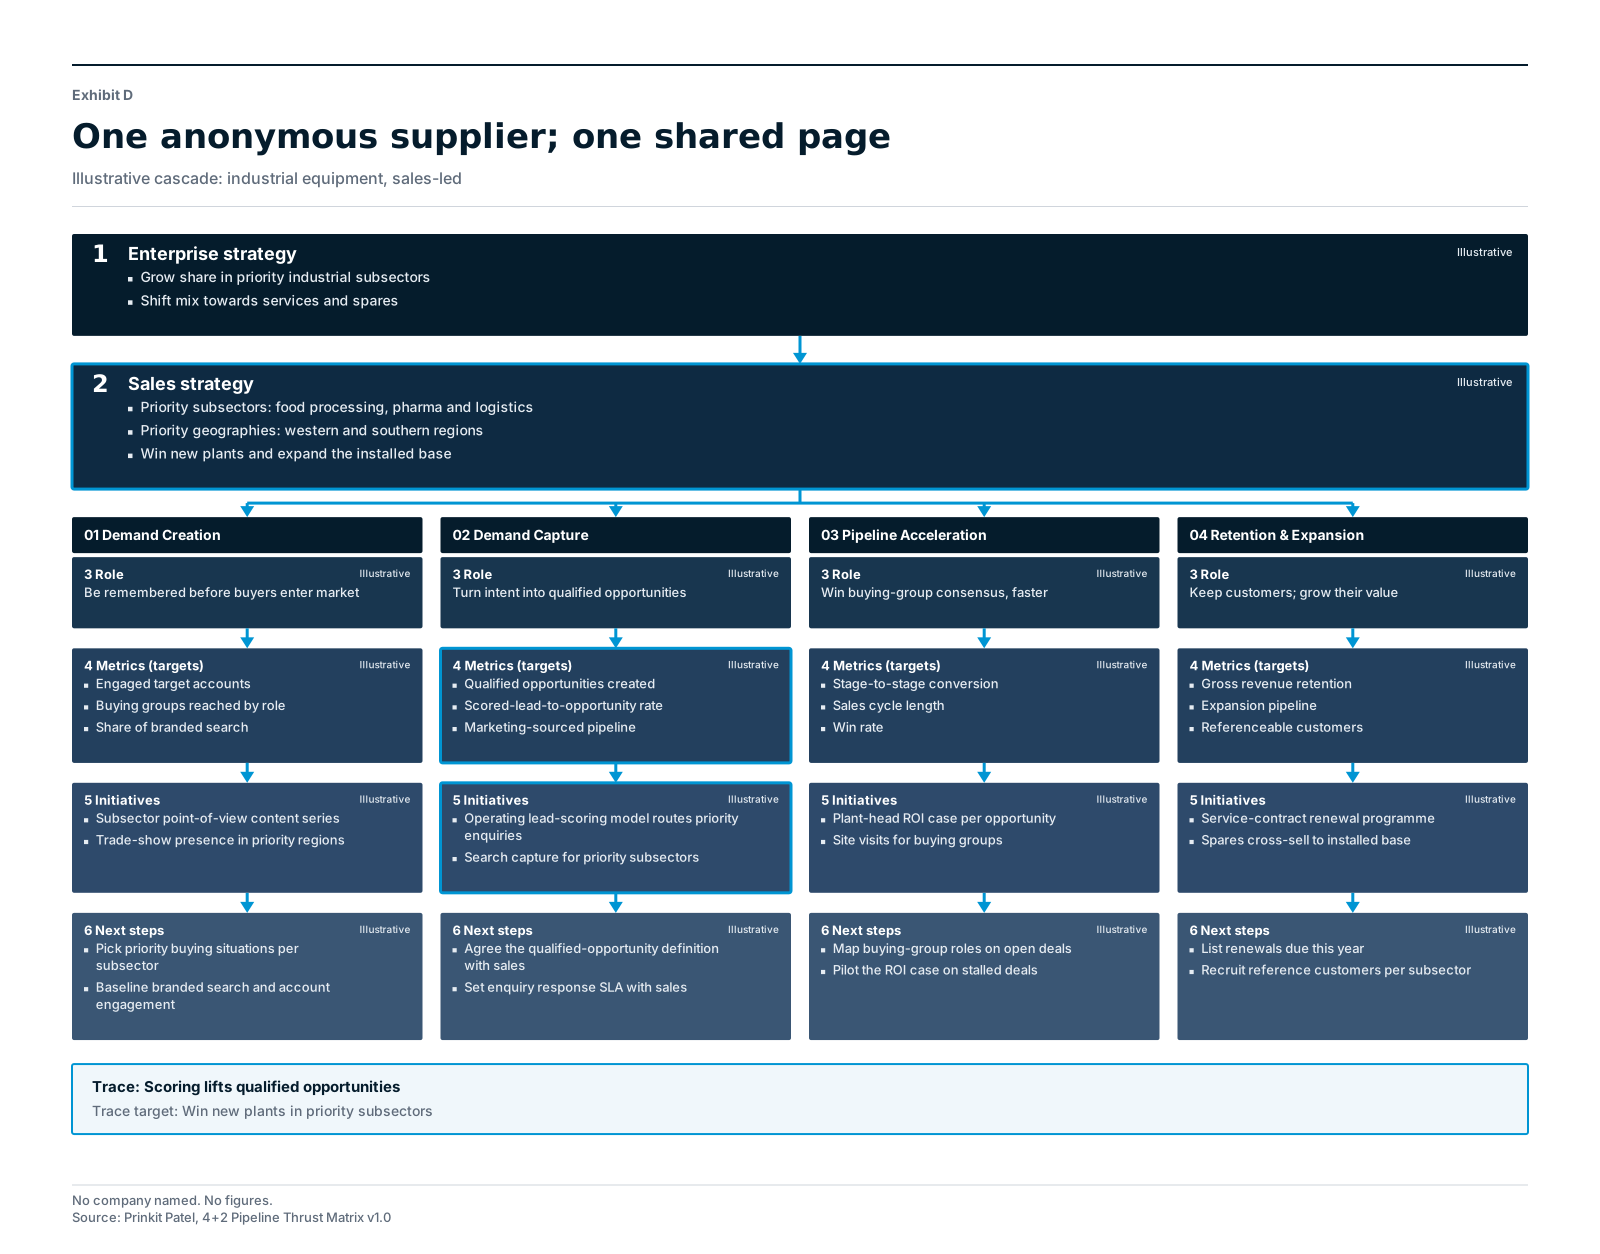
How the month runs. Marketing and sales sit with the same one-page cascade. Empty cells are gaps. Crowded cells are candidates to cut. The scoring model's conversion from scored lead to qualified opportunity is on the Capture column, not buried in a RevOps side deck. Stalled deals without a mapped buying group sit on Acceleration. Renewals due this year sit on Retention & Expansion. Foundations report whether pipeline is traceable and whether any capability build is overdue for handover into run-state.
What we do not do in the example. We do not invent a win-rate lift or a rupee return. We do not name a real company. We do not treat the cascade as a forecast model. It is a planning and diagnostic sheet. The numbers, when a team fills them, come from their CRM and their agreed definitions, not from this paper.
Review monthly with sales. Rebalance quarterly. If Acceleration is the leak, do not add more Capture spend until consensus work is in place. Fix drag before adding thrust.
5. How the 4+2 plugs into the waterfall, MEDDPICC and ABM
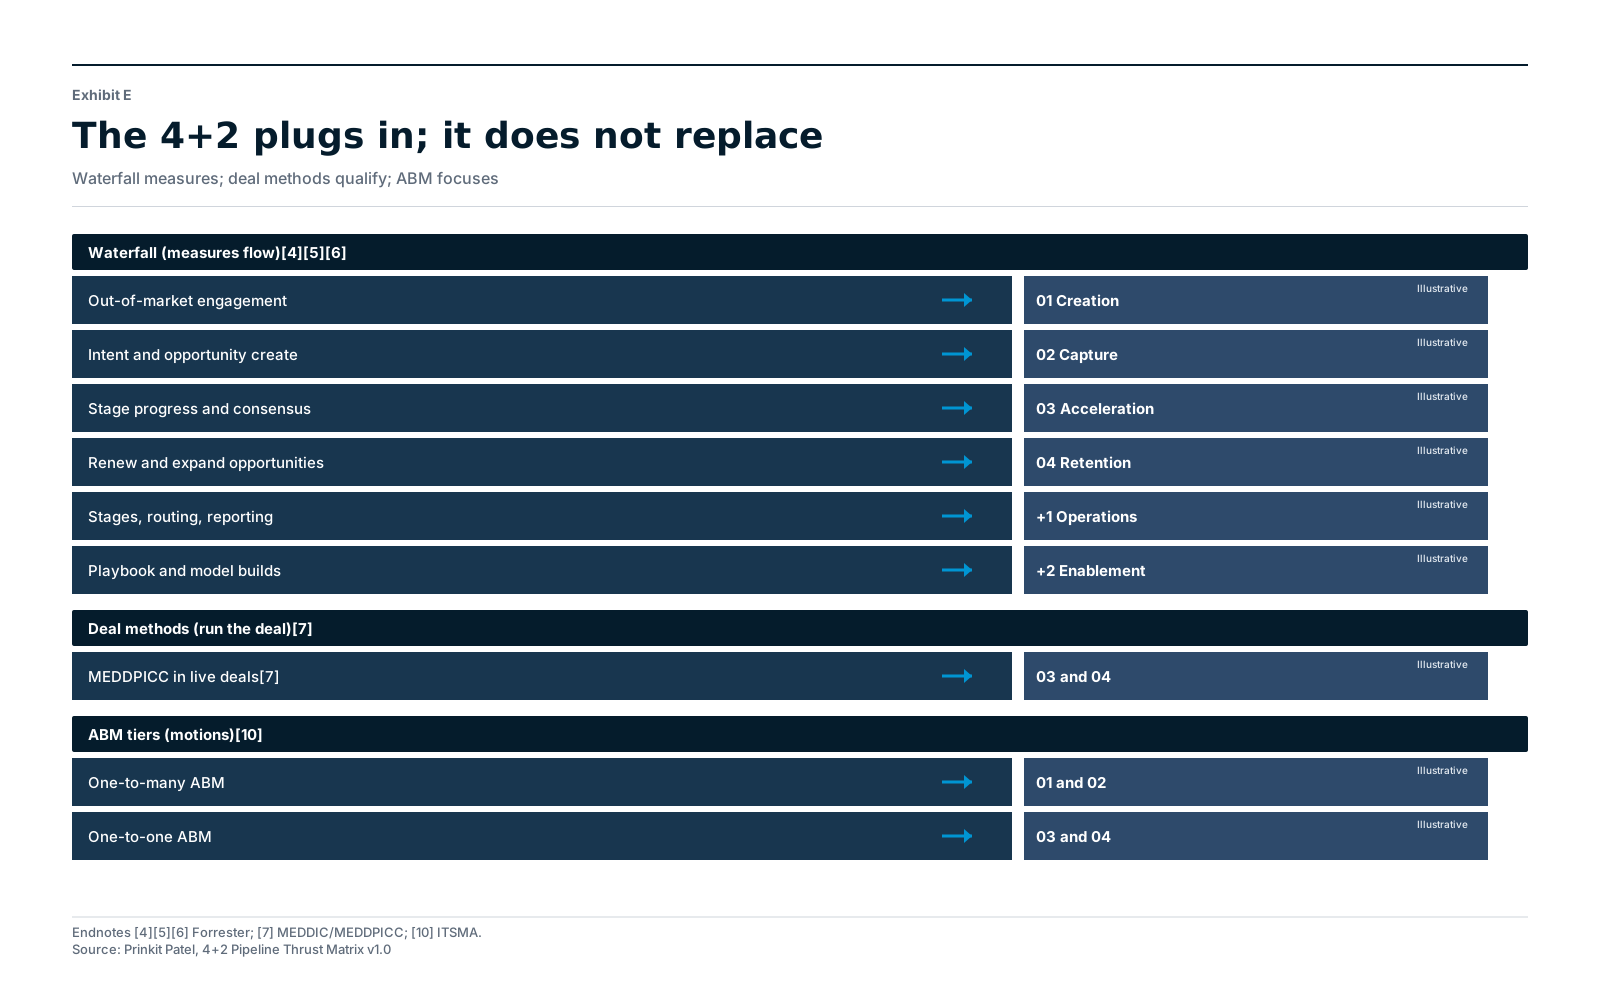
The 4+2 is not a rival to the tools good revenue teams already use. It is the planning layer that sits above them.
Demand waterfall
The SiriusDecisions Demand Waterfall began as a lead-stage model (2006, rearchitected 2012). The 2017 Demand Unit Waterfall shifted the unit of analysis to buying groups ("demand units").[4] Forrester's B2B Revenue Waterfall (2021) is opportunity-centric: it targets buying groups and adds renewal, cross-sell and upsell opportunity types, with demand-programme objectives of Activate, Validate and Accelerate.[5][6]
The waterfall measures flow. The 4+2 plans and funds the initiatives that move it. Map roughly: out-of-market engagement to Demand Creation; in-market intent and opportunity creation to Demand Capture; stage progression and consensus to Pipeline Acceleration; renewals and expansion opportunities to Retention & Expansion; stage definitions and reporting to Revenue Operations; the builds that lift conversion to Revenue Enablement.
If your waterfall says conversion from engaged to qualified is the leak, the 4+2 response is not "buy more media". It is: is Capture's scoring and response SLA fit for purpose, or is Creation sending the wrong accounts into the top? If the leak is pipeline to close, look at Acceleration and at whether Enablement has ever shipped a consensus playbook. The waterfall tells you where. The 4+2 tells you what to fund.
MEDDPICC and other deal methods
MEDDIC was developed at PTC in the 1990s and evolved into MEDDICC and MEDDPICC, a deal-qualification method (Metrics, Economic buyer, Decision criteria, Decision process, Paper process, Identify pain, Champion, Competition).[7] The Challenger Sale (Dixon and Adamson, 2011) is a seller-behaviour model: teach, tailor, take control.[8] SPIN Selling (Rackham, 1988) is a questioning method for large sales.[9]
These run inside the deal. Playbooks in use sit in Pipeline Acceleration and Retention & Expansion. Designing or upgrading those playbooks sits in Revenue Enablement. The 4+2 does not replace them; it decides where they live in the portfolio and which metric they move.
A common failure mode is to train the sales force on MEDDPICC and then leave marketing on a lead-volume target. The two systems never meet. In the 4+2, marketing's Acceleration metrics (stage-to-stage conversion, cycle length, buying-group roles engaged) are the bridge. When marketing helps put proof in front of the economic buyer and maps the buying group on open opportunities, MEDDPICC stops being a sales-only checklist and becomes a shared operating language for the middle of the funnel.
Account-based marketing
ITSMA describes three types: Strategic ABM (one-to-one), ABM Lite (one-to-few) and Programmatic ABM (one-to-many).[10] They are motions, not a fifth pillar. One-to-many usually spans Creation and Capture; one-to-few spans Capture and Acceleration; one-to-one often sits in Acceleration and Retention & Expansion for named accounts. Account selection and intent data sit with Revenue Operations. Account plans and training design sit with Revenue Enablement until they are in run-state.
For enterprise and industrial teams, ABM is often the right motion for named accounts and for clusters that share a subsector need. It is still a motion inside the 4+2. If ABM becomes the whole marketing plan, Creation for the wider in-market-but-not-named universe disappears, and next year's pipeline thins out.
Brand evidence that justifies the Creation / Capture split
Dawes's 95-5 heuristic and Binet and Field's brand/activation balance are not the 4+2. They are why Demand Creation is its own pillar and why a portfolio that funds only Capture is incomplete.[1][2] Use the Binet and Field ratio as a diagnostic for spend balance across Creation and Capture, not as a target to hit to the percentage point.
Put simply: use the waterfall to see where flow breaks; use MEDDPICC (or Challenger, or SPIN) to qualify and advance the deal; use ABM tiers to focus intensity on the right accounts; use the 4+2 to decide what marketing will fund, own and measure this quarter in service of the sales target. That is how growth marketing earns a seat in the revenue plan without pretending to be sales.
6. Short self-assessment
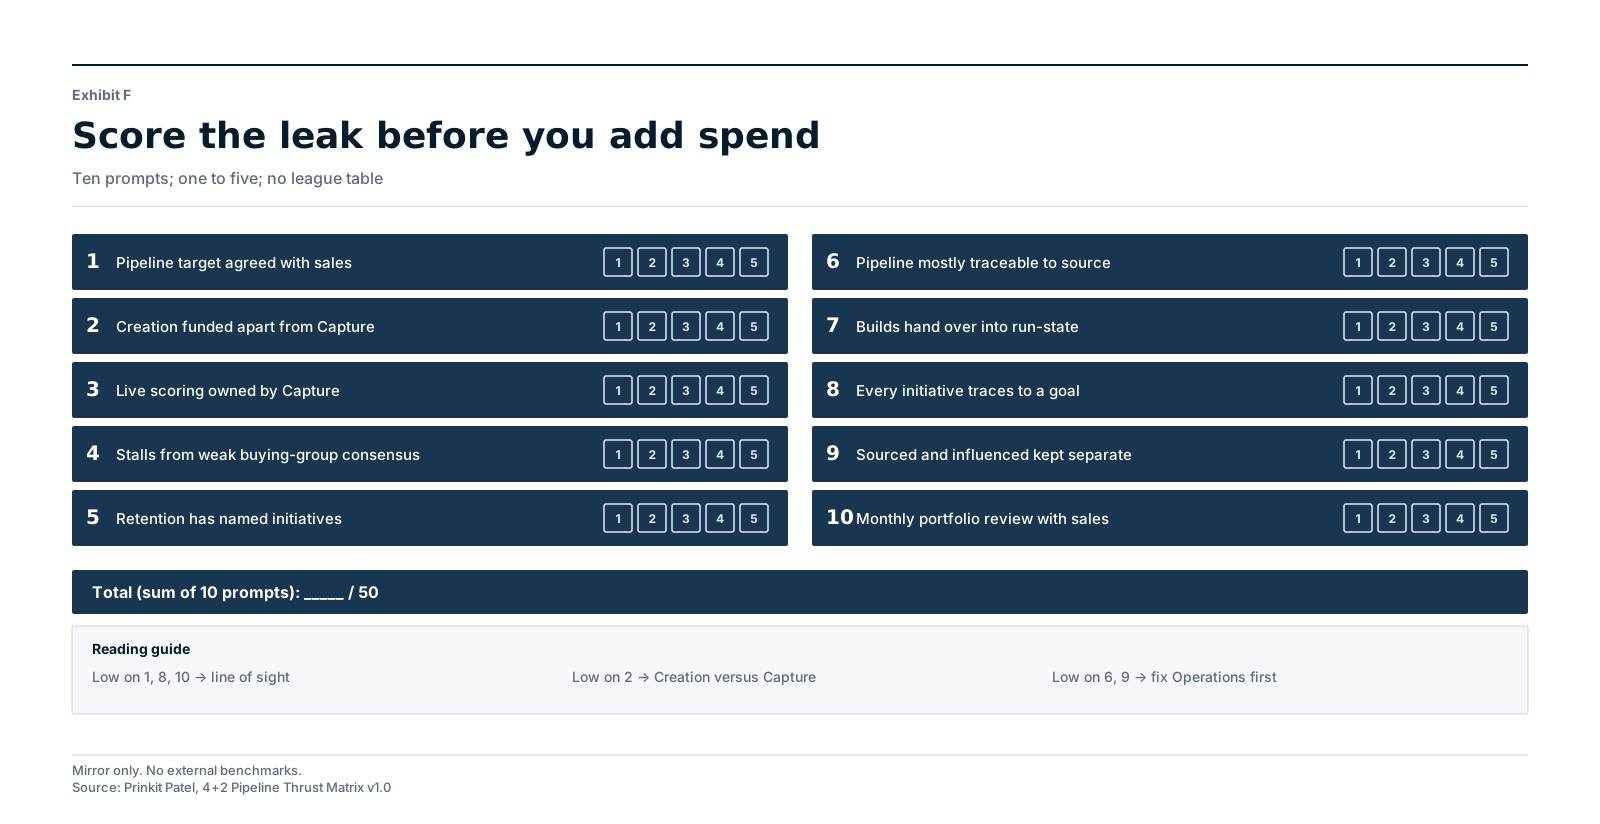
Before you redesign the year, score where you are. Ten minutes with sales in the room is enough. Score each prompt from 1 (not true) to 5 (clearly true). No external benchmarks: this is a mirror, not a league table.
- Marketing's pipeline-contribution target is named and agreed with sales.
- Demand Creation is funded and measured separately from Demand Capture.
- An operating lead-scoring model (if you have one) is owned as Capture work, not as an endless tool project.
- We can see which open deals stall for lack of buying-group consensus.
- Retention and expansion have named initiatives, not only "customer marketing when we have time".
- Most pipeline can be traced to a source; enquiry response times are known.
- We keep a backlog of capability builds, and we retire them into run-state when live.
- Every active initiative traces to an enterprise or sales objective.
- Sourced and influenced pipeline are reported separately.
- Marketing and sales review the same portfolio monthly.
Reading the score. Low on 1, 8 or 10: line-of-sight problem; start with Section 3. Low on 2: Creation/Capture mix-up; use Exhibit G and the Binet and Field diagnostic. Low on 3 or 7: run-state vs build confusion; apply the placement rule. Low on 4 or 5: Acceleration or Retention gap; do not buy more Capture until those pillars have owners. Low on 6 or 9: foundation drag; fix Revenue Operations before adding spend.
A useful team ritual: score separately, then compare. Where marketing and sales diverge by two points or more, that cell is your first workshop, not your first agency brief. The self-assessment is also how you decide the quarter's focus. The 4+2 is a portfolio, not a checklist. You do not have to be strong everywhere at once. You have to be honest about the leak, fund the fix, and measure the contribution in language the revenue plan already understands.
Closing
Growth marketing earns a seat in the revenue plan when three things are true at once. The enterprise goal is clear. The sales target is shared. Marketing's initiatives and metrics sit on the same page, in the same language, with one owner each. The 4+2 Pipeline Thrust Matrix is the structure I use to make that true: four pillars create thrust, two foundations cut drag, and line of sight runs from company goal to next step. Use it with the waterfall, with MEDDPICC, with ABM. Do not use it as an excuse to ignore them. And do not wait for perfect attribution before you plan for value: that wait is how marketing stays a cost centre.
If you take only one action from this paper, take this: sit with sales for one hour, draw the cascade, and place every live marketing initiative in one pillar. Retire what cannot climb the line of sight. Fund the empty cell that sales feels every week. Agree sourced and influenced as separate numbers. That hour will tell you more than another quarter of channel optimisation without a plan.
7. Version and citation
Version: 1.0
Publication date (decided): 29 October 2026 (IST) for ungated web and PDF on prinkit.com; SSRN preprint within 14 days of web live. Citation year: 2026.
Creator: Prinkit Patel
Recommended citation:
Patel, P. (2026). The 4+2 Pipeline Thrust Matrix: how growth marketing earns a seat in the revenue plan. prinkit.com.
Attribution line for reuse: 4+2 Pipeline Thrust Matrix by Prinkit Patel, prinkit.com.
Licence (decided): Creative Commons Attribution-NoDerivatives 4.0 International (CC BY-ND 4.0). Free to share unchanged with attribution; no derivatives. Templates and exhibits are generic illustrations and do not use proprietary client or company data.
A preprint will be lodged on SSRN after the web and PDF release so the canonical URL exists first.
Endnotes
[1] Dawes, J. (May 2021). Advertising effectiveness and the 95-5 rule: most B2B buyers are not in the market right now. Ehrenberg-Bass Institute for Marketing Science / LinkedIn B2B Institute. https://marketingscience.info/news-and-insights/advertising-effectiveness-and-the-95-5-rule-most-b2b-buyers-are-not-in-the-market-right-now
[2] Binet, L. & Field, P. (2019). The 5 Principles of Growth in B2B Marketing. LinkedIn B2B Institute (IPA Databank). https://business.linkedin.com/content/dam/me/business/en-us/amp/marketing-solutions/images/lms-b2b-institute/pdf/LIN_B2B-Marketing-Report-Digital.pdf
[3] Doerr, J. (2018). Measure What Matters. Portfolio / Penguin. OKRs learned from Andy Grove at Intel.
[4] Lillian, J. (17 May 2017). "Meet the Newest SiriusDecisions Demand Waterfall!" Forrester. https://www.forrester.com/blogs/meetthenewestsiriusdecisionsdemandwaterfall/
[5] Forrester (4 May 2021). "Forrester Debuts Next-Generation B2B Revenue Waterfall To Help Firms Accelerate Revenue Growth." https://www.forrester.com/press-newsroom/forrester-debuts-next-generation-b2b-revenue-waterfall-to-help-firms-accelerate-revenue-growth/
[6] Cross, L. & Brown, V. (7 Oct 2021). "Demand Program Plays: Get And Move Buying Group Members Through The Waterfall." Forrester. https://www.forrester.com/blogs/demand-program-plays-get-and-move-buying-group-members-through-the-waterfall/
[7] MEDDIC originated at PTC in 1996; commonly credited to Dick Dunkel and Jack Napoli under John McMahon; later extended to MEDDICC / MEDDPICC. See MEDDICC, "Who Created MEDDIC?" https://meddicc.com/resources/who-created-meddic
[8] Dixon, M. & Adamson, B. (10 Nov 2011). The Challenger Sale: Taking Control of the Customer Conversation. Portfolio (Penguin).
[9] Rackham, N. (1988). SPIN Selling. McGraw-Hill.
[10] ITSMA three types of ABM (Strategic / ABM Lite / Programmatic), as summarised in ITSMA & ABM Leadership Alliance, 2021 ABM Benchmark Study, and MarTech, "What is account-based marketing?" https://martech.org/what-is-account-based-marketing-or-abm-and-why-are-b2b-marketers-so-bullish-on-it/
Related: framework hub (glossary, FAQ, Demand Creation, Demand Capture, Pipeline Acceleration). The 4+2 Growth Matrix and why the 4+2 Growth Matrix is now the 4+2 Pipeline Thrust Matrix.